Statistical Methods
Overview
We used two primary statistical tools. We will now describe the motivation and rationale behind their use and how they helped or hindered our project.
Rayleigh Test for Uniformity
We wanted to understand if volcanic eruptions display cyclical patterns. To begin with, our data necessitated the use of directional statistics because of its angularity. When we say directional statistics we mean the following:
One of our modules used directional statistics in order to calculate the mean angle, mean vector (a measure of angular dispersion), circular standard deviation, and variance. We ultimately wanted to know if eruptions were occurring at various phases of tidal forces with equal probability or whether there are phases where more volcanoes are erupting. Hence, the answer to that would tell us if there is or is not seasonality in volcanic eruptions.
Therefore, we used the Rayleigh Test for uniformity to determine whether or not the data follows a von Mises distribution. The von Mises, also known as the circular normal distribution, is very similar to the wrapped normal distribution. Therefore, we can, in a sense, consider the Rayleigh test as a test for normality. An example von Mises distribution is the following:
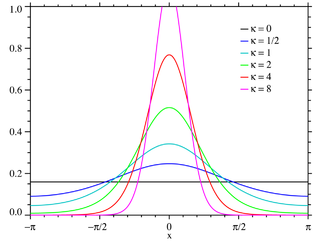
If we believe that the relationship is unimodal, and hence normally distributed, then we should see little to no relationship in the data overall (when it comes to trends and patterns). However, if there is some form of a relationship, then we expect to reject the null hypothesis and argue in favor of the alternate that suggests that the data is less normal. (For our alternate) We will say that this suggests some sort of trend or hidden relationship in the data between eruption rate and phase.
Random Forest Classifier
In order to determine the importance of the features, we decided to use a Random Forest Classifier. The reason being, a Random Forest Classifier uses a decision tree to randomly test different subsets of features. Through this random selection and separation of features, it arrives at an estimator that has a greater chance of "stumbling" onto the optimal decision boundary of a set of features. We specifically wanted to use a classifier because we did not see excessively strong cyclical trends in the data. So we lessened the requirements that the eruptions were occurring at a period and wanted to simply determine if we could accurately predict whether an eruption would occur during the upper portion of the tidal force or the lower portion.
Given that our target variable is non-categorical we categorize it and then we use sklearn's Random Forest Classifier. We were also particularly keen on using this because it comes with a feature importance estimator that would allow us to see which features are most important. Iterating through the combination of all features, we used the F1 score within the decision tree. This is because our data was highly skewed (many representative samples of particular types), so we wanted to use a scoring system that would take the skewing into account.